As we all know that crypto currency markets are known for their volatility. As their price often come in contact with sharp rise and falls. For beginners looking for understanding the concept and market analysis about crypto currency they can easily decide whole in two parts :-
- Technical Analysis
- Fundamental Analysis
With right approach we can assess the market more confidently. In this blog we will take all basis of crypto currency price analysis and provide practical step for beginners to start their journey.
- Basic of Price Analysis
Price analysis can be divided into two categories :-
Fundamental Analysis ( FA ) :- This involves the study of technology behind the crypto currency including intrinsic value of the asset.
Technical Analysis ( TA ) :- This involves the study of previous data like charts and candles at different time frame. Predict the future price movements. It also includes the trends pattern and trading volume.
- Choose Your crypto currency :-
Before making the analysis , you should have to choose the coin or crypto currency depending upon various factor like market cap , liquidity etc. For beginners I will suggest to go with less volatile currency and have a well established in market. As for example , Bitcoin ( BTC ) or Ethereum ( ETH ) , because they are less volatile and price fluctuation are around limited range.
- To know candle stick charts :-
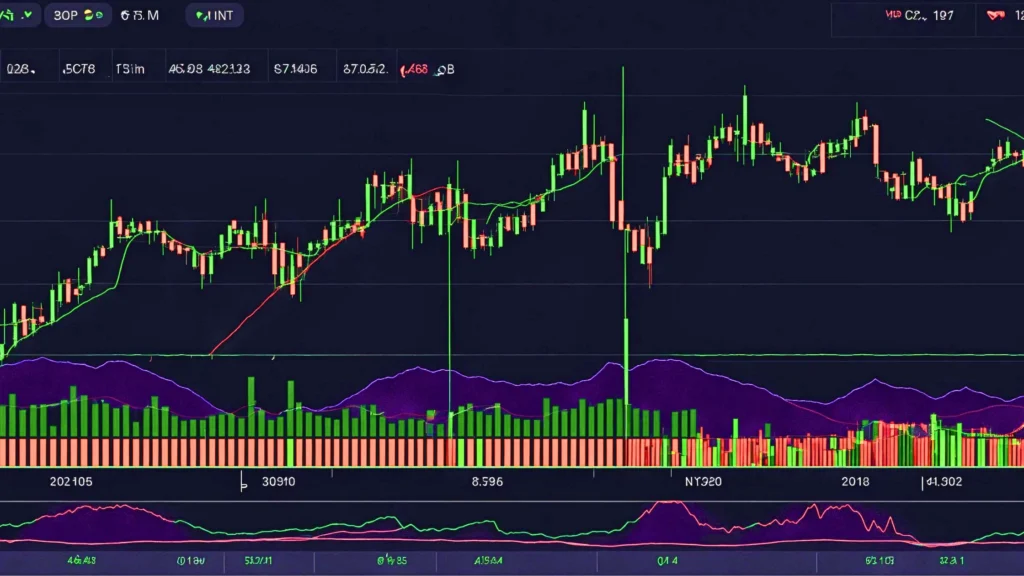
Candle stick charts pattern is one of the most widely used tools in technical analysis. This pattern tells about the price movements of the asset in different time frame. Following things should be known about this chart pattern.
Red colour candle indicates a price drop and green candle indicates a price increase of the assets.
Support & Resistance :-
- Supports :- It is a point of legal where market take supports it means at supports level market stop falling.
- Resistance :- It is level where market behave like a resistance and stops rising.
- Using Indicators :-
While anlysing the market it is very helpful to take the advantage of indicators. Here are some important indicators :-
- Moving average :-
Moving Average :- is an indicators that overall indicates the market direction in given interval of time. Moving average is of two types :-
- Simple Moving Average ( SMA )
- Exponential Moving Average ( EMA )
- RSI ( Relation Strength Index ) :-
It is type of momentum indicator the measure the value of change in price recently. RSI is most used on 14 day time frame. It si developed by J.welles wilder and published in a book named : Nes concepts in technical trading system”, in 1978.
- MACD ( Moving Average Convergence/Divergence ) :-
It is a trading indicator. In MACD it is collection of three times series MACD helps to identify changes in market trends and momentum.
- Updated with market Sentiments :-
Market sentiments play a vital role in price movements of currency. Pay attention to –
- News & Events
- Follow Social media Forums.
- Keep learning & Stay Updated :-
- Follow Crypto News outlets & Blog.
- Join Online Communities.
Conclusion :-
As become a good anlyzer of crypto currency. By mastering basic indicators and chart patterns. Analyzing support and resistance. As you know crypto currency market is volatile, understanding price trends can give you a social edge in making profitable decisions.


